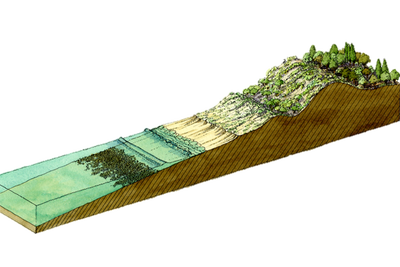
1. Qualitative Data- It is data that you cannot measure, it is an opinion of a rating. Sometimes taken from artists or focus groups - i.e- A sketch of a beach.
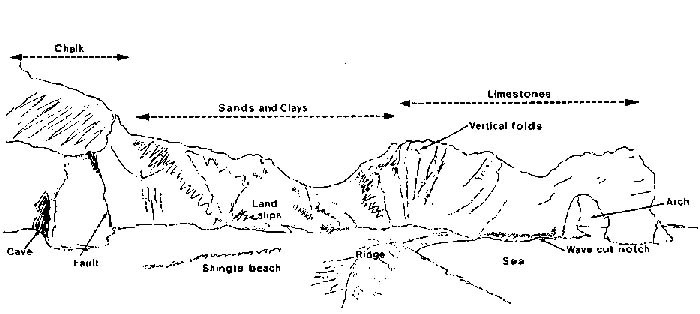
2. Quantitative Data- It is data that is numerical or statistical. Sometimes taken from surveys or official records - i.e- A diagram of a beach.
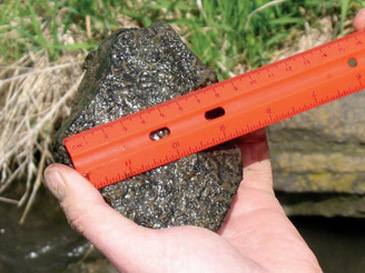
3. Primary Data- It is data that you collect yourself - i.e- Measuring the volume of 10 pebbles up a beach.

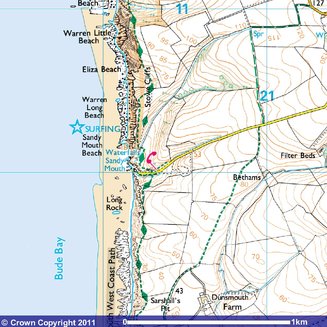
4. Secondary Data- It is data that you collect from someone else's research- i.e- reading a map of a beach.
5. Random Data- It is data collected randomly thought an area, using a random number generator to find the areas to measure - i.e- measuring pebble size on a beach
6. Systematic Data- It is data collected at set points throughout an area, using the same distance between each measurement - i.e- measuring the angle up a beach every 3 meters
7. Stratified Data- It is data that you split up and then you take a random sample from; with these random sample, you get a better idea of the data you're measuring than if you did it completely randomly - i.e- measuring stone size on a beach

8. Systematic Data- Is a type of probability sampling method in which sample members from a larger population are selected according to a random starting point and a fixed periodic interval
9. Transect- A transect is a line following a route along which a survey or observations are made. The transect is an important geographic tool for studying changes in human and/or physical characteristics from one place to another.
10. How we collected our data- We collected to the data of the volume of the pebbles by filling a jug with 1000ml of water and then placing 10 pebbles in the water. We then measured the difference in the volume of water in the jug and divided by 10 to get the average volume of 1 pebble. To measure the angle of the beach, we placed a meter ruler in the ground and then another one 3 meters up the beach. Then using the gun clinometer we measured the angle between the two. We repeated this process all the way up the beach untill we had enough data to create a transect graph of the beach.
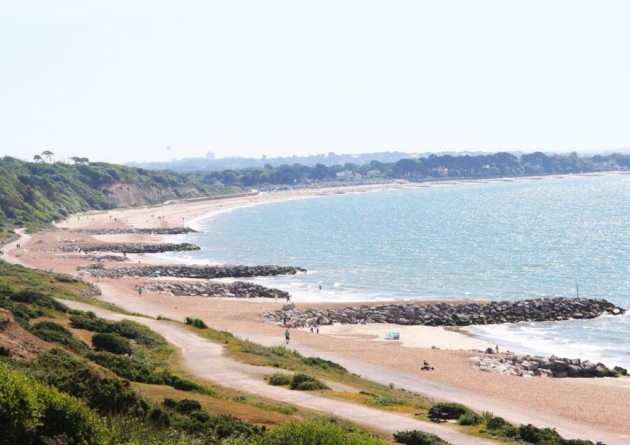
Null hypothesis- We predicted that the longshore drift would not travel from west to east along the coast of Highcliffe. We disproved this by watching where the sediment was disposed when hitting the groins. We can prove this withe the picture of Highcliffe, as shown in the picture above. Our transect diagrams didnt prove this as the most easterly and the most westerly transects (Graph 1 and 5 respectively) have both got their highest points at roughly 3 meters. Graph 1 goes up 4 meters and across 33 meters. Graph 2 goes up 7.5 meters and across 54 meters. Graph 3 goes up 5 meters and across 21 meters. Graph 4 goes up 3 meters and across 30 meters. Finally, Graph 5 goes up 3 meters and across 30 meters.
